JVM 性能监控与调优
# 一、Java 命令工具
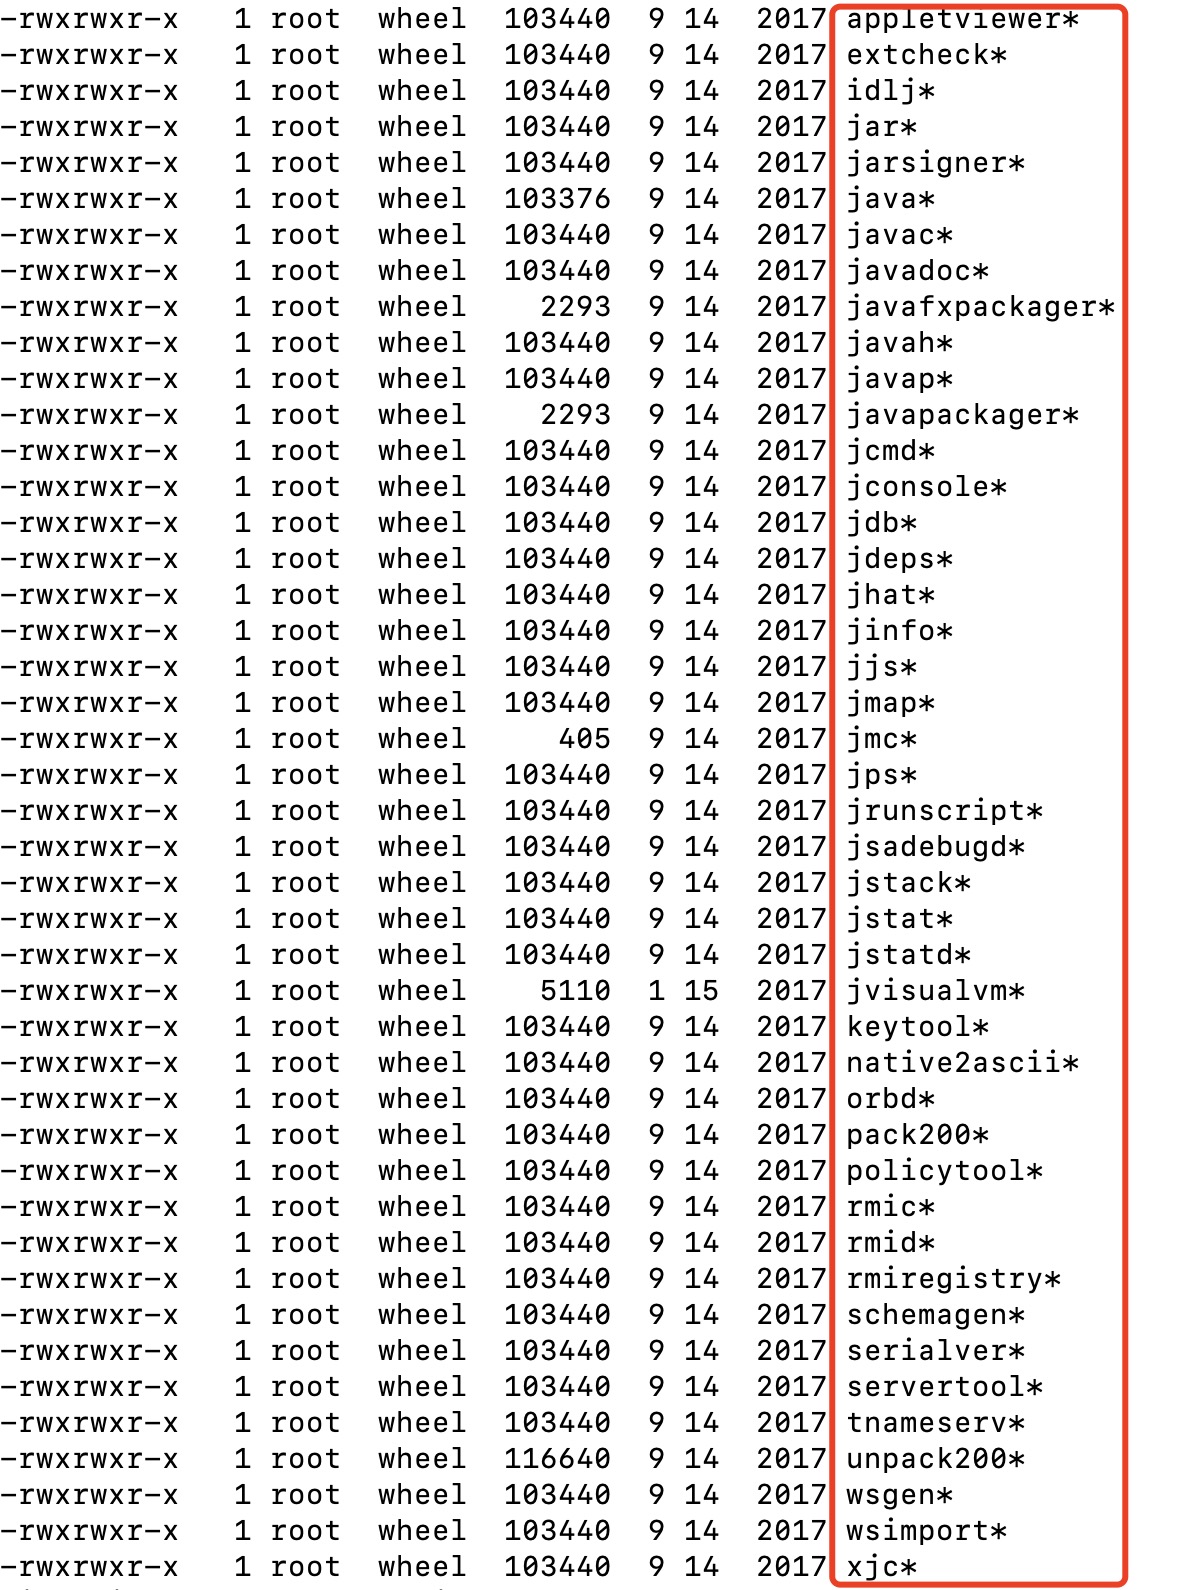
Java 默认提供了很多的分析工具,它们和我们最熟悉的java、javac命令都在$JAVA_HOME/bin目录下:
不同版本的 JDK 以及不同操作系统上提供的命令可能会有部分差异,但是绝大部分都是一样的,介绍几个常用的。
# 1.1 jps
全名 JVM Process Status Tool,用以查看 JVM 进程状况。
语法:
jps --help

usage: jps [--help]
       jps [-q] [-mlvV] [<hostid>]

Definitions:
    <hostid>:      <hostname>[:<port>]
    -? -h --help -help: Print this help message and exit.
2
3
4
5
6
7
8
选项:
- -q:只输出 LVMID,省略主类名称。
- -m:输出虚拟机进程启动时传递给
main()函数的参数。 - -l:输出主类的全名,如果进程执行的是 jar 包,则输出 jar 路径。
- -v:输出虚拟机进程启动时的 JVM 参数。
# 1.2 jstat
全名 JVM Statistics Monitoring Tool,用以查看 JVM 统计信息。
语法:
jstat --help
Usage: jstat --help|-options
       jstat -<option> [-t] [-h<lines>] <vmid> [<interval> [<count>]]

Definitions:
  <option>      An option reported by the -options option
  <vmid>        Virtual Machine Identifier. A vmid takes the following form:
                     <lvmid>[@<hostname>[:<port>]]
                Where <lvmid> is the local vm identifier for the target
                Java virtual machine, typically a process id; <hostname> is
                the name of the host running the target Java virtual machine;
                and <port> is the port number for the rmiregistry on the
                target host. See the jvmstat documentation for a more complete
                description of the Virtual Machine Identifier.
  <lines>       Number of samples between header lines.
  <interval>    Sampling interval. The following forms are allowed:
                    <n>["ms"|"s"]
                Where <n> is an integer and the suffix specifies the units as
                milliseconds("ms") or seconds("s"). The default units are "ms".
  <count>       Number of samples to take before terminating.
  -J<flag>      Pass <flag> directly to the runtime system.
  -? -h --help  Prints this help message.
  -help         Prints this help message.
2
3
4
5
6
7
8
9
10
11
12
13
14
15
16
17
18
19
20
21
22
23
选项:
- -class:监视类加载、卸载数量、总空间以及类装载所耗费的时间。
- -gc:监视 Java 堆状况,包括伊甸区、两个幸存者区、老年代、永久代等的容量,已用空间,垃圾收集时间合计等信息。
- -gccapacity:监视内容与 -gc 基本相同,但是输出主要关注 Java 堆各个区域使用到的最大最小空间。
- -gcutil:监视内容与 -gc 基本相同,但是输出主要关注已使用空间占总空间的百分比。
- -gccause:与 -gcutil 功能一样,但是会额外输出导致上一次垃圾收集产生的原因。
- -gcnew:监视新生代垃圾收集状况。
- -gcnewcapacity:监视内容与 -gcnew 基本相同,输出主要关注使用到的最大最小空间。
- -gcold:监视老年代垃圾收集状况。
- -gcoldcapacity:监视内容与 -gcold 基本相同,输出主要关注使用到的最大最小空间。
- -gcpermcapacity:输出永久代使用到的最大最小空间。
- -compiler:输出即使编译器编译过的方法、耗时等信息。
- -printcompilation:输出已经被即时编译的方法。
- -interval:用于指定输出统计数据的周期,单位为毫秒。即:查询间隔。
- -count:用于指定查询的总次数。
- -t:可以在输出信息前加上一个 Timestamp 列,显示程序的运行时间。单位:秒。
- -h:可以在周期性数据输出时,输出多少行数据后输出一个表头信息。
关于-gc参数输出结果的说明:
- 新生代相关:
- S0C:第一个幸存者区的大小(字节)。
- S1C:第二个幸存者区的大小(字节)。
- S0U:第一个幸存者区已使用的大小(字节)。
- S1U:第二个幸存者区已使用的大小(字节)。
- EC:Eden 空间的大小(字节)。
- EU:Eden 空间已使用大小(字节)。
- 老年代相关:
- OC:老年代的大小(字节)。
- OU:老年代已使用的大小(字节)。
- 方法区(元空间)相关:
- MC:方法区的大小。
- MU:方法区已使用的大小。
- CCSC:压缩类空间的大小。
- CCSU:压缩类空间已使用的大小。
- 其它
- YGC:从应用程序启动到采样时 young gc 的次数。
- YGCT:指从应用程序启动到采样时 young gc 消耗时间(秒)。
- FGC:从应用程序启动到采样时 full gc 的次数。
- FGCT:从应用程序启动到采样时的 full gc 的消耗时间(秒)。
- GCT:从应用程序启动到采样时 gc 的总时间。
-gc使用示例:
jstat -gc 1

S0C      S1C       S0U   S1U    EC        EU        OC         OU         MC       MU       CCSC    CCSU      YGC   YGCT     FGC     FGCT   GCT
209664.0 209664.0  0.0   9173.5 1677824.0 1366208.2 2097152.0  1038700.9  112860.0 106509.5 13708.0 12486.6   4859  182.935  36      4.259  187.194
2
3
4
# 1.3 jinfo
全名 Configuration Info for Java,用以实时查看 JVM 配置参数。
语法:
jinfo --help
Usage:
    jinfo <option> <pid>
       (to connect to a running process)

where <option> is one of:
    -flag <name>         to print the value of the named VM flag
    -flag [+|-]<name>    to enable or disable the named VM flag
    -flag <name>=<value> to set the named VM flag to the given value
    -flags               to print VM flags
    -sysprops            to print Java system properties
    <no option>          to print both VM flags and system properties
    -? | -h | --help | -help to print this help message
2
3
4
5
6
7
8
9
10
11
12
13
使用:
- 查看 JMV 参数:
- jinfo -sysprops pid:可以查看由
System.getProperties()取得的参数。 - jinfo -flags pid:查看曾经赋过值的一些参数。
- jinfo -flag 参数名称 pid:查看某个 Java 进程的具体参数信息。
- jinfo -sysprops pid:可以查看由
- 修改 JVM 参数:
- jinfo -flag [+|-]参数名称 pid:将某个布尔类型的参数设置为 true 或 false。
- jinfo -flag 参数名称=参数值 进程 id:指定某个键值类型参数的值。
# 1.4 jmap
全名 Memory Map for Java,用以生成堆转储快照(一般称为 heapdump 或 dump 文件)。
语法:
jmap --help
Usage:
    jmap -clstats <pid>
        to connect to running process and print class loader statistics
    jmap -finalizerinfo <pid>
        to connect to running process and print information on objects awaiting finalization
    jmap -histo[:[<histo-options>]] <pid>
        to connect to running process and print histogram of java object heap
    jmap -dump:<dump-options> <pid>
        to connect to running process and dump java heap
    jmap -? -h --help
        to print this help message

    dump-options:
      live         dump only live objects (takes precedence if both "live" and "all" are specified)
      all          dump all objects in the heap (default if one of "live" or "all" is not specified)
      format=b     binary format
      file=<file>  dump heap to <file>
      gz=<number>  If specified, the heap dump is written in gzipped format using the given compression level.
                   1 (recommended) is the fastest, 9 the strongest compression.

    Example: jmap -dump:live,format=b,file=heap.bin <pid>

    histo-options:
      live                count only live objects (takes precedence if both "live" and "all" are specified)
      all                 count all objects in the heap (default if one of "live" or "all" is not specified)
      file=<file>         dump data to <file>
      parallel=<number>   Number of parallel threads to use for heap inspection:
                          0 (the default) means let the VM determine the number of threads to use
                          1 means use one thread (disable parallelism).
                          For any other value the VM will try to use the specified number of threads, but might use fewer.

    Example: jmap -histo:live,file=/tmp/histo.data <pid>
2
3
4
5
6
7
8
9
10
11
12
13
14
15
16
17
18
19
20
21
22
23
24
25
26
27
28
29
30
31
32
33
选项:
- -dump:生成堆内存快照。-dump:live 只保存堆中的存活对象。
- -finalizerinfo:显示在 F-Queue 中等待 Finalizer 线程执行 finalize 方法的对象。
- -heap:显示堆内存详细信息。如参数配置、使用哪种收集器、分代状态等。
- -histo:显示堆中对象统计信息。包括类、实例数量、合计信息等。-histo:live 只统计堆中的存活对象。
- -permstat:以 ClassLoader 为口径显示永久代内存状态。仅 linux/solaris 平台有效。
- -F:当虚拟机进程对-dump 选项没有任何响应时,可使用此选项强制执行生成 dump 文件。
- -J <flag>:传递参数给 jmap 启动的 jvm。
-dump参数说明:
- 手动生成内存快照:
jmap -dump:format=b,file=<filename.hprof> <pid>jmap -dump:live,format=b,file=<filename.hprof> <pid>
- 自动生成内存快照:
- 指定
-XX:+HeapDumpOnOutOfMemoryError和-XX:HeapDumpPath=<filename.hprof>参数
- 指定
# 1.5 jhat
全名 JVM Heap Analysis Tool,与 jmap 搭配使用,来分析 jmap 生成的堆转储快照。
语法:
jhat -help
Usage:  jhat [-stack <bool>] [-refs <bool>] [-port <port>] [-baseline <file>] [-debug <int>] [-version] [-h|-help] <file>

	-J<flag>          Pass <flag> directly to the runtime system. For
			  example, -J-mx512m to use a maximum heap size of 512MB
	-stack false:     Turn off tracking object allocation call stack.
	-refs false:      Turn off tracking of references to objects
	-port <port>:     Set the port for the HTTP server.  Defaults to 7000
	-exclude <file>:  Specify a file that lists data members that should
			  be excluded from the reachableFrom query.
	-baseline <file>: Specify a baseline object dump.  Objects in
			  both heap dumps with the same ID and same class will
			  be marked as not being "new".
	-debug <int>:     Set debug level.
			    0:  No debug output
			    1:  Debug hprof file parsing
			    2:  Debug hprof file parsing, no server
	-version          Report version number
	-h|-help          Print this help and exit
	<file>            The file to read

For a dump file that contains multiple heap dumps,
you may specify which dump in the file
by appending "#<number>" to the file name, i.e. "foo.hprof#3".
2
3
4
5
6
7
8
9
10
11
12
13
14
15
16
17
18
19
20
21
22
23
24
选项:
- -stack true|false:打开或关闭对象分配调用栈跟踪。
- -refs true|false:打开或关闭对象引用跟踪。
- -port <port>:设置 jhat http 服务的端口号,默认 7000。
- -exclude <file>:执行对象查询时需要排除的数据成员列表文件。
- -baseline <file>:指定一个基准堆转储。
- -debug <int>:设置 debug 级别。
- -version:启动后显示版本信息就退出。
# 1.6 jstack
全名 Stack Trace for Java,用以生成 JVM 当前时刻的线程快照。
语法:
jstack --help
Usage:
    jstack [-l][-e] <pid>
        (to connect to running process)

Options:
    -l  long listing. Prints additional information about locks
    -e  extended listing. Prints additional information about threads
    -? -h --help -help to print this help message
2
3
4
5
6
7
8
9
选项:
- -F:当正常输出的请求不被响应时,强制输出线程堆栈。
- -l:除堆栈外,显示关于锁的附加信息。
- -m:如果调用到本地方法,显示 C/C++堆栈信息。
# 1.7 jcmd
多功能命令行。
语法:
jcmd -h
Usage: jcmd <pid | main class> <command ...|PerfCounter.print|-f file>
   or: jcmd -l
   or: jcmd -h

  command must be a valid jcmd command for the selected jvm.
  Use the command "help" to see which commands are available.
  If the pid is 0, commands will be sent to all Java processes.
  The main class argument will be used to match (either partially
  or fully) the class used to start Java.
  If no options are given, lists Java processes (same as -l).

  PerfCounter.print display the counters exposed by this process
  -f  read and execute commands from the file
  -l  list JVM processes on the local machine
  -? -h --help print this help message
2
3
4
5
6
7
8
9
10
11
12
13
14
15
16
选项:
- -l:列出所有 JVM 进程。
- pid help:针对指定进程,列出所有支持的命令。
- pid command:显示执行指定进程命令的数据。
# 1.8 jstatd
收集远程主机信息。
# 二、GUI 工具
# 三、JVM 参数
# 3.1 参数分类
JVM 参数整体可以分为三类:
- 标配参数
- -X 参数
- -XX 参数
# 3.1.1 标配参数
标配参数以“-”开头,比较稳定,后续版本基本不会变化。运行 java、java -h或java --help可以看到所有标配参数。
java

用法:java [options] <主类> [args...]
           (执行类)
   或  java [options] -jar <jar 文件> [args...]
           (执行 jar 文件)
   或  java [options] -m <模块>[/<主类>] [args...]
       java [options] --module <模块>[/<主类>] [args...]
           (执行模块中的主类)
   或  java [options] <源文件> [args]
           (执行单个源文件程序)

 将主类、源文件、-jar <jar 文件>、-m 或 --module <模块>/<主类> 后的参数作为参数传递到主类。

 其中,选项包括:

    -cp <目录和 zip/jar 文件的类搜索路径>
    -classpath <目录和 zip/jar 文件的类搜索路径>
    --class-path <目录和 zip/jar 文件的类搜索路径>
                  使用 : 分隔的, 用于搜索类文件的目录, JAR 档案
                  和 ZIP 档案列表。
    -p <模块路径>
    --module-path <模块路径>...
                  用 : 分隔的目录列表, 每个目录
                  都是一个包含模块的目录。
    --upgrade-module-path <模块路径>...
                  用 : 分隔的目录列表, 每个目录
                  都是一个包含模块的目录, 这些模块
                  用于替换运行时映像中的可升级模块
    --add-modules <模块名称>[,<模块名称>...]
                  除了初始模块之外要解析的根模块。
                  <模块名称> 还可以为 ALL-DEFAULT, ALL-SYSTEM,
                  ALL-MODULE-PATH.
    --list-modules
                  列出可观察模块并退出
    -d <module name>
    --describe-module <模块名称>
                  描述模块并退出
    --dry-run     创建 VM 并加载主类, 但不执行 main 方法。
                  此 --dry-run 选项对于验证诸如
                  模块系统配置这样的命令行选项可能非常有用。
    --validate-modules
                  验证所有模块并退出
                  --validate-modules 选项对于查找
                  模块路径中模块的冲突及其他错误可能非常有用。
    -D<名称>=<值>
                  设置系统属性
    -verbose:[class|module|gc|jni]
                  为给定子系统启用详细输出
    -version      将产品版本输出到错误流并退出
    --version     将产品版本输出到输出流并退出
    -showversion  将产品版本输出到错误流并继续
    --show-version
                  将产品版本输出到输出流并继续
    --show-module-resolution
                  在启动过程中显示模块解析输出
    -? -h -help
                  将此帮助消息输出到错误流
    --help        将此帮助消息输出到输出流
    -X            将额外选项的帮助输出到错误流
    --help-extra  将额外选项的帮助输出到输出流
    -ea[:<程序包名称>...|:<类名>]
    -enableassertions[:<程序包名称>...|:<类名>]
                  按指定的粒度启用断言
    -da[:<程序包名称>...|:<类名>]
    -disableassertions[:<程序包名称>...|:<类名>]
                  按指定的粒度禁用断言
    -esa | -enablesystemassertions
                  启用系统断言
    -dsa | -disablesystemassertions
                  禁用系统断言
    -agentlib:<库名>[=<选项>]
                  加载本机代理库 <库名>, 例如 -agentlib:jdwp
                  另请参阅 -agentlib:jdwp=help
    -agentpath:<路径名>[=<选项>]
                  按完整路径名加载本机代理库
    -javaagent:<jar 路径>[=<选项>]
                  加载 Java 编程语言代理, 请参阅 java.lang.instrument
    -splash:<图像路径>
                  使用指定的图像显示启动屏幕
                  自动支持和使用 HiDPI 缩放图像
                  (如果可用)。应始终将未缩放的图像文件名 (例如, image.ext)
                  作为参数传递给 -splash 选项。
                  将自动选取提供的最合适的缩放
                  图像。
                  有关详细信息, 请参阅 SplashScreen API 文档
    @argument 文件
                  一个或多个包含选项的参数文件
    -disable-@files
                  阻止进一步扩展参数文件
    --enable-preview
                  允许类依赖于此发行版的预览功能
要为长选项指定参数, 可以使用 --<名称>=<值> 或
--<名称> <值>。
2
3
4
5
6
7
8
9
10
11
12
13
14
15
16
17
18
19
20
21
22
23
24
25
26
27
28
29
30
31
32
33
34
35
36
37
38
39
40
41
42
43
44
45
46
47
48
49
50
51
52
53
54
55
56
57
58
59
60
61
62
63
64
65
66
67
68
69
70
71
72
73
74
75
76
77
78
79
80
81
82
83
84
85
86
87
88
89
90
91
92
93
94
# 3.1.2 -X 参数
-X 参数以“-X”开头,执行java -X可以看到所有选项。
java -X
    -Xbatch           禁用后台编译
    -Xbootclasspath/a:<以 : 分隔的目录和 zip/jar 文件>
                      附加在引导类路径末尾
    -Xcheck:jni       对 JNI 函数执行其他检查
    -Xcomp            强制在首次调用时编译方法
    -Xdebug           不执行任何操作。为实现向后兼容而提供。
    -Xdiag            显示附加诊断消息
    -Xfuture          启用最严格的检查,预期将来的默认值。
                      此选项已过时,可能会在
                      未来发行版中删除。
    -Xint             仅解释模式执行
    -Xinternalversion
                      显示比 -version 选项更详细的
                      JVM 版本信息
    -Xlog:<opts>      配置或启用采用 Java 虚拟
                      机 (Java Virtual Machine, JVM) 统一记录框架进行事件记录。使用 -Xlog:help
                      可了解详细信息。
    -Xloggc:<file>    将 GC 状态记录在文件中(带时间戳)。
                      此选项已过时,可能会在
                      将来的发行版中删除。它将替换为 -Xlog:gc:<file>。
    -Xmixed           混合模式执行(默认值)
    -Xmn<size>        为年轻代(新生代)设置初始和最大堆大小
                      (以字节为单位)
    -Xms<size>        设置初始 Java 堆大小
    -Xmx<size>        设置最大 Java 堆大小
    -Xnoclassgc       禁用类垃圾收集
    -Xrs              减少 Java/VM 对操作系统信号的使用(请参见文档)
    -Xshare:auto      在可能的情况下使用共享类数据(默认值)
    -Xshare:off       不尝试使用共享类数据
    -Xshare:on        要求使用共享类数据,否则将失败。
                      这是一个测试选项,可能导致间歇性
                      故障。不应在生产环境中使用它。
    -XshowSettings    显示所有设置并继续
    -XshowSettings:all
                      显示所有设置并继续
    -XshowSettings:locale
                      显示所有与区域设置相关的设置并继续
    -XshowSettings:properties
                      显示所有属性设置并继续
    -XshowSettings:vm
                      显示所有与 vm 相关的设置并继续
    -XshowSettings:system
                      (仅 Linux)显示主机系统或容器
                      配置并继续
    -Xss<size>        设置 Java 线程堆栈大小
    -Xverify          设置字节码验证器的模式
                      请注意,选项 -Xverify:none 已过时,
                      可能会在未来发行版中删除。
    --add-reads <module>=<target-module>(,<target-module>)*
                      更新 <module> 以读取 <target-module>,而无论
                      模块如何声明。
                      <target-module> 可以是 ALL-UNNAMED,将读取所有未命名
                      模块。
    --add-exports <module>/<package>=<target-module>(,<target-module>)*
                      更新 <module> 以将 <package> 导出到 <target-module>,
                      而无论模块如何声明。
                      <target-module> 可以是 ALL-UNNAMED,将导出到所有
                      未命名模块。
    --add-opens <module>/<package>=<target-module>(,<target-module>)*
                      更新 <module> 以在 <target-module> 中打开
                      <package>,而无论模块如何声明。
    --illegal-access=<value>
                      允许或拒绝通过未命名模块中的代码对命名模块中的
                      类型成员进行访问。
                      <value> 为 "deny"、"permit"、"warn" 或 "debug" 之一
                      此选项将在未来发行版中删除。
    --limit-modules <module name>[,<module name>...]
                      限制可观察模块的领域
    --patch-module <module>=<file>(:<file>)*
                      使用 JAR 文件或目录中的类和资源
                      覆盖或增强模块。
    --source <version>
                      设置源文件模式中源的版本。

这些额外选项如有更改, 恕不另行通知。


以下选项是特定于 macOS 的选项:
    -XstartOnFirstThread
                      在第一个 (AppKit) 线程上运行 main() 方法
    -Xdock:name=<application name>
                      覆盖停靠栏中显示的默认应用程序名称
    -Xdock:icon=<path to icon file>
                     覆盖停靠栏中显示的默认图
2
3
4
5
6
7
8
9
10
11
12
13
14
15
16
17
18
19
20
21
22
23
24
25
26
27
28
29
30
31
32
33
34
35
36
37
38
39
40
41
42
43
44
45
46
47
48
49
50
51
52
53
54
55
56
57
58
59
60
61
62
63
64
65
66
67
68
69
70
71
72
73
74
75
76
77
78
79
80
81
82
83
84
85
# 3.1.3 -XX 参数
-XX 参数以“-XX”开头,可以详细分为布尔型和键值对型两类。
布尔型参数:
布尔类型的参数用来指定某个属性为开启或关闭状态。语法为:-XX:+<option>或-XX:-<option>。其中,+表示开启,-表示关闭。
示例:
# 开启打印GC细节
-XX:+PrintGCDetails

# 关闭打印GC细节
-XX:-PrintGCDetails

# 使用Serial收集器
-XX:+UseSerialGC

# 不使用Serial收集器
-XX:-UseSerialGC
2
3
4
5
6
7
8
9
10
11
键值对类型:
键值对类型的参数用来指定某个选项的值,语法为:-XX:key=value。
示例:
# 堆内存初始大小
-XX:InitialHeapSize=128m

# 堆内存最大大小
-XX:MaxHeapSize=1024m`
2
3
4
5
提示
- 对于和空间大小相关的参数,单位可以是 k/K、m/M、g/G。
- 生产环境中一般会将
-Xmx和-Xms设置为一样,避免内存震荡带来的损耗。
# 3.2 如何向 JVM 添加参数
# 3.2.1 IDEA 开发中
TODO:补充示例
# 3.2.2 运行 jar 包
java -XX:InitialHeapSize=128m -XX:MaxHeapSize=128m -XX:+PrintGCDetails -XX:+PrintGCTimeStamps -jar demo.jar
# 3.2.3 在程序执行过程中添加
- 使用
jinfo -flag <name>=<value> <pid>设置非 Boolean 类型参数。 - 使用
jinfo -flag [+|-]<name> <pid>设置 Boolean 类型参数。
TODO:补充示例
# 四、常用的 JVM 参数
# 4.1 打印相关
-XX:+PrintCommandLineFlags:可以让程序运行前打印出用户手动设置或者 JVM 自动设置的 XX 选项。-XX:+PrintFlagsInitial:表示打印出所有 XX 选项的默认值。-XX:+PrintFlagsFinal:表示打印出 XX 选项在运行程序时生效的值。如果值的前面加上了:=,说明该值不是初始值,该值可能被 jvm 自动改变了,也可能被我们设置的参数改变了。-XX:+PrintVMOptions:打印 JVM 的参数。
# 4.2 栈相关
-Xss128k:等价于-XX:ThreadStackSize,设置每个线程的栈大小为 128k。
# 4.3 堆相关
-Xms3550m:等价于-XX:InitialHeapSize,设置 JVM 初始堆内存为 3500M。-Xmx3550m:等价于-XX:MaxHeapSize,设置 JVM 最大堆内存为 3500M。-Xmn2g:设置年轻代大小为 2G,即等价于-XX:NewSize=2g -XX:MaxNewSize=2g,也就是设置年轻代初始值和年轻代最大值都是 2G。官方推荐配置为整个堆大小的 3/8。-XX:NewSize=1024m:设置年轻代初始值为 1024M。-XX:MaxNewSize=1024m:设置年轻代最大值为 1024M。-XX:SurvivorRatio=8:设置年轻代中 Eden 区与一个 Survivor 区的比值,默认为 8。-XX:+UseAdaptiveSizePolicy:自动选择各区大小比例,默认开启。-XX:NewRatio=2:设置老年代与年轻代(包括 1 个 Eden 区和 2 个 Survivor 区)的比值,默认为 2。-XX:PretenureSizeThreadshold=1024:设置让大于此阈值的对象直接分配在老年代,单位为字节。 只对 Serial、ParNew 收集器有效。-XX:MaxTenuringThreshold=15:默认值为 15。 新生代每次 MinorGC 后,还存活的对象年龄+1,当对象的年龄大于设置的这个值时就进入老年代。-XX:+PrintTenuringDistribution:让 JVM 在每次 MinorGC 后打印出当前使用的 Survivor 中对象的年龄分布。-XX:TargetSurvivorRatio:表示 MinorGC 结束后 Survivor 区域中占用空间的期望比例。
# 4.4 永久代相关
-XX:PermSize=256m:设置永久代初始值为 256M。-XX:MaxPermSize=256m:设置永久代最大值为 256M。
# 4.5 元空间相关
-XX:MetaspaceSize:初始空间大小。-XX:MaxMetaspaceSize:最大空间,默认没有限制。-XX:+UseCompressedOops:使用压缩对象指针。-XX:+UseCompressedClassPointers:使用压缩类指针。-XX:CompressedClassSpaceSize:设置 Klass Metaspace 的大小,默认 1G。
# 4.6 直接内存相关
-XX:MaxDirectMemorySize:指定 DirectMemory 容量,若未指定,则默认与 Java 堆最大值一样。
# 4.7 OOM 相关
-XX:+HeapDumpOnOutMemoryError:表示在内存出现 OOM 的时候,生成 Heap 转储文件,以便后续分析,-XX:+HeapDumpBeforeFullGC和-XX:+HeapDumpOnOutMemoryError只能设置 1 个。-XX:+HeapDumpBeforeFullGC:表示在出现 FullGC 之前,生成 Heap 转储文件,以便后续分析,-XX:+HeapDumpBeforeFullGC和-XX:+HeapDumpOnOutMemoryError只能设置 1 个,请注意 FullGC 可能出现多次,那么 dump 文件也会生成多个。-XX:HeapDumpPath=<path>:指定 heap 转存文件的存储路径,如果不指定,就会将 dump 文件放在当前目录中。-XX:OnOutOfMemoryError:指定一个可行性程序或者脚本的路径,当发生 OOM 的时候,去执行这个脚本。
# 4.8 垃圾收集器相关
TODO:补充细节
# 4.9 GC 日志相关
-verbose:gc:输出日志信息,默认输出的标准输出。 可以独立使用。-XX:+PrintGC:等同于-verbose:gc,表示打开简化的日志。 可以独立使用。-XX:+PrintGCDetails:在发生垃圾回收时打印内存回收详细的日志,并在进程退出时输出当前内存各区域的分配情况。 可以独立使用。-XX:+PrintGCTimeStamps:程序启动到 GC 发生的时间秒数。 不可以独立使用,需要配合-XX:+PrintGCDetails使用。-XX:+PrintGCDateStamps:输出 GC 发生时的时间戳(以日期的形式,例如:2013-05-04T21:53:59.234+0800)。不可以独立使用,可以配合-XX:+PrintGCDetails使用。-XX:+PrintHeapAtGC:每一次 GC 前和 GC 后,都打印堆信息。可以独立使用。-XIoggc:<file>:把 GC 日志写入到一个文件中去,而不是打印到标准输出中。-XX:TraceClassLoading:监控类的加载。-XX:PrintGCApplicationStoppedTime:打印 GC 时线程的停顿时间。-XX:+PrintGCApplicationConcurrentTime:垃圾收集之前打印出应用未中断的执行时间。-XX:+PrintReferenceGC:记录回收了多少种不同引用类型的引用。-XX:+PrintTenuringDistribution:让 JVM 在每次 MinorGC 后打印出当前使用的 Survivor 中对象的年龄分布。-XX:+UseGCLogFileRotation:启用 GC 日志文件的自动转储。-XX:NumberOfGCLogFiles=1:GC 日志文件的循环数目。-XX:GCLogFileSize=1M:控制 GC 日志文件的大小。
# 4.10 其它参数
-XX:+DisableExplicitGC:禁用 hotspot 执行 System.gc(),默认禁用。-XX:ReservedCodeCacheSize=<n>[g|m|k]、-XX:InitialCodeCacheSize=<n>[g|m|k]:指定代码缓存的大小。-XX:+UseCodeCacheFlushing:使用该参数让 jvm 放弃一些被编译的代码,避免代码缓存被占满时 JVM 切换到 interpreted-only 的情况。-XX:+DoEscapeAnalysis:开启逃逸分析。-XX:+UseBiasedLocking:开启偏向锁。-XX:+UseLargePages:开启使用大页面。-XX:+PrintTLAB:打印 TLAB 的使用情况。-XX:TLABSize:设置 TLAB 大小。